Featuring an energy and power quality analyzer that can monetize the cost of energy waste due to poor power quality and is ideal for characterizing power quality, conducting load studies and capturing hard-to-find voltage events over a user-defined period of time.
Featuring an energy and power quality analyzer that can monetize the cost of energy waste due to poor power quality and is ideal for characterizing power quality, conducting load studies and capturing hard-to-find voltage events over a user-defined period of time.
Discontinued!
This product has been discontinued and is no longer available.
There is no direct replacement, however we recommend the:


Not what you're looking for? Let’s do a search and help you find what you need.
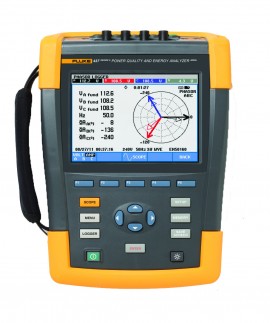
Higher power frequencies mean smaller and lighter transformers and motors – a critical concern in avionic and military transport applications where weight is a primary concern. Designed specifically for these environments, the Fluke 437 Series II Power Quality and Energy Analyzer is a must-have for those working in ships, submarines, aircraft, spacecraft and other military vehicles.
Equipped with all the functionalities of the 435 Series II, the 437 Series II offers the best in power quality and energy analysis all the way to 400 Hz.
Features
The 430 Series II Power Quality and Energy Analyzers offer the best in power quality analysis and introduce, for the first time ever, the ability to monetarily quantify energy losses.
The 434, 435 and 437 Series II models help locate, predict, prevent, and troubleshoot power quality problems in three-phase and single-phase power distribution systems. Additionally, the Fluke-patented energy loss algorithm, Unified Power Measurement, measures and quantifies energy losses due to harmonics and unbalance issues, allowing the user to pinpoint the origin of energy waste within a system.

Fluke's patented Unified Power Measurement system (UPM) provides the most comprehensive view of power available, measuring:
These UPM calculations are used to quantify the fiscal cost of energy loss caused by power quality issues. The calculations are computed, along with other facility-specific information, by an Energy Loss Calculator that ultimately determines how much money a facility loses due to wasted energy.
Traditionally energy savings are achieved by monitoring and targeting, or in other words, by finding the major loads in a facility and optimizing their operation. The cost of power quality could only be quantified in terms of downtime caused by lost production and damage to electrical equipment. The Unified Power Measurement (UPM) method now goes beyond this to achieve energy savings by discovering the energy waste caused by power quality issues. Using the Unified Power Measurement, Energy Loss Calculator (see screen shot below) will determine how much money a facility is losing due to waste energy.
UPM gives a more comprehensive breakdown of the energy consumed in the plant. In addition to measuring reactive power (caused by poor power factor), UPM also measures the energy waste caused by unbalance; the effect of unevenly loading each phase in three-phase systems. Unbalance can often be corrected by reconnecting loads on different phases to ensure the current drawn on each phase is as equal as possible. Unbalance can also be corrected by installing an unbalance reactance device (or filter), that will minimize the effects. Correcting unbalance should be basic good housekeeping in the facility as unbalance problems can cause motor failure or shorten equipment life expectancy. Unbalance also wastes energy. Using UPM can minimize or eliminate that energy waste, thus saving money.
UPM also provides details of the energy wasted in your facility due to the presence of harmonics. Harmonics may be present in your facility due to the loads you operate or may be caused by loads in adjacent facilities. The presence of harmonics in your facility can lead to:
Quantifying the cost of wasted energy due to the presence of harmonics simplifies the return-on investment calculation needed to justify purchasing harmonic filters. By installing a harmonic filter the ill effects of harmonics can be reduced and energy waste eliminated, resulting in lower operational costs and more reliable operation.


For some users, loads switching is a cause of power quality problems. When loads switch on, the current draw sometimes causes the voltage to drop to a level that causes other equipment to malfunction. The PowerWave function available in the 435 and 437 Series II models enables users to capture voltage, current and frequency signals simultaneously at a high speed to see which interaction is potentially causing problems. PowerWave goes beyond standard power quality measurements; PowerWave's fast data capture mode enables system dynamics to be characterized. Waveforms for voltage and current are continuously captured for the specified time, and are displayed on screen in high detail; the power waveform is derived from the data. In addition, half-cycle RMS values for voltage, current, power and frequency can be stored and retrieved for analysis. This feature is particularly useful for testing of standby generation systems and UPS systems where reliable switch-on can be vital.
Power inverters take DC current and transform it into AC current, or vice versa. Solar generation systems usually include an inverter that takes the DC energy from the solar cells and converts it to useful AC power. Inverters can lose performance over time and need to be checked. By comparing the input power with the output power you can determine the system efficiency. The 435 and 437 II models can measure the efficiency of such inverters by simultaneously measuring the DC and AC power of a system to determine how much power is lost in the conversion process.
Measure true-rms, peak voltage and current, frequency, dips and swells, transients, interruptions, power and power consumption, peak demand, harmonics up to the 50th, inter-harmonics, flicker, mains signaling, inrush and unbalance.
User-configurable, long-term recording of MIN, MAX and AVG readings for up to 150 parameters on all 4 phases. Enough memory is available to record 600 parameters for over a year with 10 second resolution, or capture smaller variations with resolution down to 0.25 seconds. The logger function is quickly accessed by the LOGGER button, the simple step-by-step setup makes capturing your important measurements as easy as can be.
The MONITOR mode delivers a dashboard display of rms voltage, harmonics, flicker, interruptions, rapid voltage changes, swells, unbalance, frequency and mains signaling.
The dashboard is updated live, showing compliance of each parameter to EN50160 limits or your own limits. Color-coded bars clearly show which parameters are inside (pass) or outside (fail) limits. During a monitor session, you can easily drill down to more detail of any parameter to view and capture its trend for a report.
By increasing the power frequency to 400 Hz, transformers and motors can be much smaller and lighter than at 50 or 60 Hz, which is an advantage in aircrafts, submarines, space crafts, and other military equipment and hand-held tools. The 437 II model captures power quality measurements for these types of avionic and military systems.
The 430 Series II analyzers provide three ways to analyze measurements. Cursors and zoom tools can be used "live" while taking measurements, or "off line" on stored measurement data. Additionally, the stored measurements can be transferred to a PC with the included software to perform custom analysis and create reports. Measurement data can also be exported to common spreadsheet programs. Store hundreds of measurement datasets and screen captures for use in reports (depending on memory capacity).
Pre-programmed setups and user-friendly screens make power quality testing as simple as you would expect from Fluke. The high-resolution color screen updates every 200 ms and displays waveforms and wiring diagrams color coded to industry standards. Handy on-screen wiring diagrams for all commonly used three-phase and single-phase configurations guide you through connections.
Designed to help protect you and your equipment, the 430 Series II analyzers and accessories are all certified to meet the stringent standards for use in CAT IV 600 V and CAT III 1000 V environments such as power connections and outlets throughout a low-voltage power distribution system.
Every time an event or voltage distortion is detected, the instrument triggers and automatically stores voltage and current waveforms on all three phases and neutral. The analyzer will also trigger when a certain current level is exceeded. Hundreds of dips, swells, interruptions and transients can be captured this way. You can see voltage transients as high as 6 kV and as fast as 5 microseconds.
The 435-II and 437-II are fully compliant with the new IEC 61000-4-30 Edition 2 Class-A standard. With this powerful capability, all measurements will be consistent and reliable in accordance with the latest international standard. Fluke's Class A compliance, including time synchronization compliance has been independently verified, certification is available on request.
| 437-II | 435-II | 434-II | |
|---|---|---|---|
| Measurement algorithms | |||
| Voltage accuracy | 0.1 % of Vnom | 0.1 % of Vnom | 0.5 % of Vnom |
| Class compliance | A | A | S |
| Time synchronization | Optional with GPS430 accessory | ||
Power quality measurement is a relatively new, and quickly evolving field. There are hundreds of manufacturers around the world with unique measurement methodologies. Whereas basic single- and three-phase electrical measurements like rms voltage and current were defined long ago, many power quality parameters were not previously defined, forcing manufacturers to develop their own algorithms. With so much variation between instruments, electricians tend to waste too much time trying to understand an instrument's capabilities and measurement algorithms instead of understanding the quality of the power itself! The new IEC 61000-4-30 Edition 2 Class-A standard takes the guesswork out of selecting a power quality instrument. The standard IEC 61000-4-30 Edition 2 defines the measurement methods for each parameter to obtain reliable, repeatable and comparable results. In addition, the accuracy, bandwidth and minimum set of parameters are all clearly defined. The 435 and 437 Series II models include flagging and available internal clock time-synching to fully comply with the rigorous requirements of Class A compliance. The Edition 2 standard includes a new class of instrument, Class S. While not as accurate as Class A instruments, Class S instruments such as the 434 Series II Energy Analyzer produce results that are consistent with Class A instruments.
Voltage Measurements
Amp Measurements
Harmonics Measurements
Applications
| Vrms (ac+dc) Measurement Range | 1 to 1000 V phase to neutral |
| Vrms (ac+dc) Resolution | 0.01 V |
| Vrms (ac+dc) Accuracy | ±0.1% of nominal voltage |
| Vfund Resolution | 0.1 V |
| Vfund Accuracy | ±0.1% of nominal voltage |
| Operating Temperature | 32 to 104°F (0 to 40°C); 104 to 122°F (40 to 50°C) excluding battery |
| Storage Temperature | -4 to 140°F (-20 to 60°C) |
| Electro-Magnetic-Compatibility (EMC) | EN 61326 (2005-12) for emission and immunity |
| Interfaces | Mini-USB-B, Isolated USB port for PC connectivity SD card slot accessible behind instrument battery |
 |  |  | |
| Model | Fluke 434-II | Fluke 435-II | Fluke 437-II |
|---|---|---|---|
| Standard compliance | IEC 61000-4-30 Class S | IEC 61000-4-30 Class A | IEC 61000-4-30 Class A |
| Volt Amp Hz | |||
| Dips and swells | |||
| Harmonics | |||
| Power and energy | |||
| Energy loss calculator | |||
| Unbalance | |||
| Monitor | |||
| Inrush | |||
| Event waveform capture | |||
| Flicker | |||
| Transients | |||
| Mains signaling | |||
| Power wave | |||
| Power inverter efficiency | |||
| 400Hz | |||
| C1740 Soft Case | |||
| C437-II Hard Case with rollers | |||
| SD card (Max 32 GB) | 8 GB | 8 GB | 8 GB |
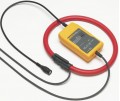
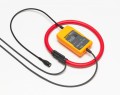
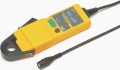
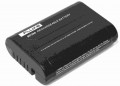
All models include the following accessories TL430 test lead set, 4 x i430 thin flexi current probes, BP290 battery, BC430 power adapter with international power adapter set, USB cable A-B mini and PowerLog CD.
Perform custom analysis and create reports with included software. Measurement data can also be exported to common spreadsheet programs.

Designed to quickly view recorded data, the included Power Log software displays all recorded parameters on interactive trends. Generate a professional report with the 'Report Writer' function, or copy and paste images into report document manually.
FlukeView Power Quality Analyzer Software (SW43W) offers you simple mouse-controlled tools to work with your Power Quality Analyzer.
The FlukeView software communicates with your Power Quality Analyzer via the optically isolated OC4USB adapter/cable connected to the USB of the PC. The OC4USB driver creates a virtual COM port. FlukeView will handle the USB port as a COM port.
Note:
The optional RS-232 adapter/cable PM9080 allows you to communicate via a COM port of your PC.
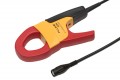
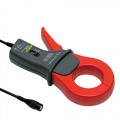
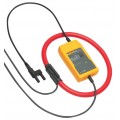
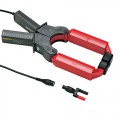
Click on a category to view a selection of compatible accessories with the Fluke 437-II Power Quality and Energy Analyzer.


| Vrms (ac+dc) Measurement Range | 1 to 1000 V phase to neutral |
| Vrms (ac+dc) Resolution | 0.01 V |
| Vrms (ac+dc) Accuracy | ±0.1% of nominal voltage |
| Vfund Resolution | 0.1 V |
| Vfund Accuracy | ±0.1% of nominal voltage |
| Operating Temperature | 32 to 104°F (0 to 40°C); 104 to 122°F (40 to 50°C) excluding battery |
| Storage Temperature | -4 to 140°F (-20 to 60°C) |
| Electro-Magnetic-Compatibility (EMC) | EN 61326 (2005-12) for emission and immunity |
| Interfaces | Mini-USB-B, Isolated USB port for PC connectivity SD card slot accessible behind instrument battery |
| | | |
| Model | Fluke 434-II | Fluke 435-II | Fluke 437-II |
|---|---|---|---|
| Standard compliance | IEC 61000-4-30 Class S | IEC 61000-4-30 Class A | IEC 61000-4-30 Class A |
| Volt Amp Hz | |||
| Dips and swells | |||
| Harmonics | |||
| Power and energy | |||
| Energy loss calculator | |||
| Unbalance | |||
| Monitor | |||
| Inrush | |||
| Event waveform capture | |||
| Flicker | |||
| Transients | |||
| Mains signaling | |||
| Power wave | |||
| Power inverter efficiency | |||
| 400Hz | |||
| C1740 Soft Case | |||
| C437-II Hard Case with rollers | |||
| SD card (Max 32 GB) | 8 GB | 8 GB | 8 GB |
All models include the following accessories TL430 test lead set, 4 x i430 thin flexi current probes, BP290 battery, BC430 power adapter with international power adapter set, USB cable A-B mini and PowerLog CD.
Perform custom analysis and create reports with included software. Measurement data can also be exported to common spreadsheet programs.
Designed to quickly view recorded data, the included Power Log software displays all recorded parameters on interactive trends. Generate a professional report with the 'Report Writer' function, or copy and paste images into report document manually.
FlukeView Power Quality Analyzer Software (SW43W) offers you simple mouse-controlled tools to work with your Power Quality Analyzer.
The FlukeView software communicates with your Power Quality Analyzer via the optically isolated OC4USB adapter/cable connected to the USB of the PC. The OC4USB driver creates a virtual COM port. FlukeView will handle the USB port as a COM port.
Note:
The optional RS-232 adapter/cable PM9080 allows you to communicate via a COM port of your PC.
Click on a category to view a selection of compatible accessories with the Fluke 437-II Power Quality and Energy Analyzer.