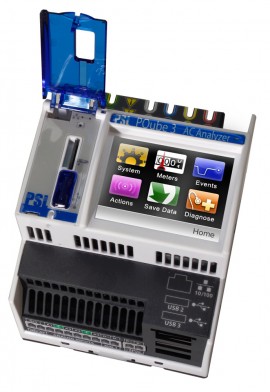
PQube 3 AC Analyzer with 4 Voltage and 8 Current Channels. Power Quality Class A with Energy Revenue Grade Class 0.2s Accuracy & Additional AC, DC, and Environment Sensor Channels.
PQube 3 AC Analyzer with 4 Voltage and 8 Current Channels. Power Quality Class A with Energy Revenue Grade Class 0.2s Accuracy & Additional AC, DC, and Environment Sensor Channels.
Discontinued!
This product has been discontinued and is no longer available. There are no replacement options.
We can help you find what you need:
The PQube power quality analyzer is a tiny, user-friendly power quality recorder with built-in power, energy, and carbon emissions monitoring. With the PQube, there is no software required - all recorded data is written directly onto an SD memory card in a number of ready-to-use formats including HTML web pages, spreadsheets (Excel-compatible CSV files), pictures (GIF images, eg for power/energy trends and waveforms on power quality events), text, XML and PQDIF (the IEEE standard for power quality data files.)
Applications
Semiconductor Manufacturing
Industrial Equipment
Medical
Security Scanning at Airports
Power Companies
Facility Management Companies
Military Bases, Government Campuses, Large Facilities
Data Centers
Telecom
Researchers
Green Initiatives
Distributed Generation - Wind and Solar
Energy Audits & Power Quality Consulting
How can I enable the PQube3 to display the present screen on the web interface?
It is possible to put the PQube3 in a mode where the web page adds a button [Display] and shows a copy of the Pqube3 screen display. To do this:
Make sure you turn this tag OFF after the demo, when enabled, this feature is very CPU intensive and slows PQube3's reactivity.
Can I use the same USB stick to collect measurement data from several PQube3's?
Yes. Each PQube3 creates their own folder on the USB stick as /P300XXXX, where XXXX is the last 4 digits of the PQube3 serial number, eliminating the need to carry multiple USBs.
The IEC standards define two ranges of supra harmonics: 2-9 kHz and 9-150 kHz. Why is the first frequency of the 9-150 kHz spectrum display 8 kHz?
The IEC standards define two ranges of supra harmonics: 2-9 kHz and 9-150 kHz. Why is the first frequency of the 9-150 kHz spectrum display 8 kHz?
What is the isolation level and isolation impedance between the mains terminals and the analog terminals?
The isolation level between mains voltage terminals L1/L2/L3/N to earth, per IEC 61010 is 4700 VDC. The overall isolation between analog/digital and mains voltage terminals is also 4700 VDC. The impedance between the analog terminals and the mains terminals is approximately 5 to 6 Mohms. Since the analog circuits and mains voltage circuits are interconnected through various electronic components, a direct impedance measurement done with a multi-meter between those terminals might give a different value/result.
Can you erase the measurement data from PQube3 memory?
This can only be done, if you are physically in front of the PQube3. This can be done by using the touch screen buttons [Actions][Clear]. This erases the measurement data folder and the system logs. The configuration, the firmware, and the calibration information remain unaffected.
How is PQube3 synchronizing with NTP or SNTP protocols?
PQube3 achieves NTP synchronization by implementing an application under Linux called "NTP". This application requests a time update at an interval whose duration can be set in the configurator from one hour to several days. PQube3 achieves SNTP synchronization by implementing an application under Linux called "NTPdate". Both of these applications are clients, regularly requesting a time update to a single distant server.
| Mains Voltage Channels | 3× Line-to-Neutral, 3× Line-to-Line, 3× Line-to-Earth, 1× Neutral-to-Earth |
| Input Impedance/Burden | 33.3kΩ< 1VA for CTs |
| Voltage Harmonics and Interharmonics | Fully compliant and certified to IEC 61000-4-30 Ed. 3 Class A Range 10% ~ 200% of Class 3 of IEC 61000-2-4 Accuracy : ±5% of reading for signals ≥ 1% of nominal, ±0.05% of nominal for signals < 1% nominal voltage |
| GPS (with optional Sync module) | Accuracy <1 microsecond |
| Magnitude Accuracy | ±0.01% typical |
| Angle Accuracy | ±0.010° typical |
| Single-Phase orThree-Phase | Every PQube 3 supports all worldwide power configurations:single-phase, split-single-phase, wye/star, delta, corner-grounded delta, red-leg delta |
| Voltage Measurement Range | 750 VAC (L-N), 1300 VAC (L-L), (±6 kV impulse) |
| Nominal Frequency | 16.7Hz*, 50 Hz, 60 Hz, or 400 Hz* |
| Simultaneous Sampling Rates | 512 Samples per cycle, 4.0 MHz impulse sampling, 1.0 MHz 2Khz-150Khz emissions sampling |
| Measurement range | 0 VAC ~ 900 VAC L-L (520 VAC L-N) |
| Physical Connection | Plug-in screw terminal block |
| Measurement Channels | 8 inputs : I1, I2, I3, I4, I5, I6, I7, I8 (typically used as L1, L2, L3, N, E, I6, I7, I8) |
| HF Impulse detection | 1A, 5A, 20A... 100A, 500A...6000A ranges available through CTs Nominal for the CT outputs : 0.333 Vrms (Low Range) or 3.33 Vrms (High range) - user selected... |
| Crest Factor | 3.5 (±1.17 Vpk) (Low Range) or 3.0 (±10 Vpk) (High range) |
| Accuracy - excluding external CT's | ±0.05% rdg ±0.05% FS typical (1% ~ 200% FS) |
| Sampling Rate | Same rate as mains voltage measuring channels |
| CT Input Ratio Range | 1:1 to 50000:1 |
| Physical Connection | Interfaces with External CT (current transformer), voltage-type secondary 5 or 8 pairs of pluggable screw terminals (Max torque 2 inch-pounds (0,25Nm)) |
| Wire Connection | Connections to feeder wires are done by clamping on split core CTs around the feeder.Connection of the CT voltage output to the PQube3 input terminal: Min wire size 28AWG (0,8 mm2), Max. 16AWG (1,31mm2). 600V UL- recognized insulation required. |
| Measurement Channels | ser-selected Standard Mode or DC Energy ModeStandard Mode: AN1-E, AN2-E, AN3-E, AN4-E (common mode), AN1-AN2, AN3-AN4 (differential mode)DC Energy Mode: AN1×AN2, AN3×AN4 (bi-directional DC Power), AN1×AN2×hours, AN3×AN4×hours (DC Energy) |
| Nominal input (Full Scale) | High range: ±60 VDC to Earth. Low range: ±10VDC to Earth. |
| Measurement range | High range: ±100 VDC, Low range ±10 VDC. |
| Accuracy | ±0.05% rdg ±0.05% FS typical (1% ~ 100% FS), ANx-E |
| Internal Pull-Up Voltage | 2.5VDC |
| Analog Ratio Range | 1:1 to 10000:1 |
| Input impedance | 1MΩ to Earth |
| Rating | Typical 3.3VDC, 5VDC, 24VDC. Maximum input 60VDC (differential input) |
| Wetting | 2.2 VDC typical. Can be used with NC or NO dry contacts. |
| Digital Threshold | 1.5V ±0.2V with 0.1V hysteresis typical. |
| Sampling Rate | Same rate as mains voltage measuring channels |
| Input impedance | >1MΩ |
| Physical Connection | Pluggable screw terminals (Max torque 2 inch-pounds (0,25Nm)) DIG1+ and DIG1- |
| Connection | RLY1 pluggable screw terminals standard (RLY2, RLY3, RLY4 screw terminals with factory installed option) |
| Rating | 30 VAC/30 VDC, 300 mA max |
| Function | When PQube 3 is off, normally open. When PQube 3 is on, normally closed. Contacts open for duration of event or 3 seconds (whichever is longer). |
| Operate Time | 20 milliseconds |
| Watts (power) | Sum of true instantaneous per-phase bi-directional power, taken over the measurement interval. |
| Volt-Amps (apparent power) | Sum of per-phase product of RMS voltage and RMS current, taken over the measurement interval. |
| Power Factor | True power factor-ratio of Watts to Volt-Amps |
| VARs (volt-amps reactive) | Fundamental VARs on L1, L2, L3 and total |
| Voltages | L-N, or L-Nm for delta configurations. Nm defined as measurement neutral, the instantaneous mean of the three L-E voltages. |
| Currents | L1, L2, L3 |
| Measurement interval | Phase-locked, 10-cycles (50 Hz nominal) or 12-cycles (60 Hz nominal). |
| Watts (power) | ±0.1% rdg typical at unity power factor, nominal voltage, 10% ~ 100% FS current. ±0.2% rdg typical at 0.5 power factor, nominal voltage, 10% ~ 100% FS current. |
| Frequency | Range 40 Hz ~ 70 Hz and 320 Hz ~ 560 Hz, Accuracy ±0.01 Hz, steady state |
| Voltage Amplitude | Range 10% ~ 200% of nominal - Accuracy ±0.1% Udin (Udin = 120V, 230V) Method: True single-cycle RMS, phase-locked to each channel, updated every ½ cycle. URMS½ per IEC 61000-4-30 Class A. Also 10/12 cycle true-RMS per IEC 61000-4-30 Class A. |
| Flicker | Pinst, Pst, Plt fully compliant and certified to IEC 61000-4-15 Ed. 2 Class F1 |
| Voltage dips/swells/interruptions | Fully compliant and certified to IEC 61000-4-30 Ed. 3 Class A, Accuracy ±0.2% of nominal voltage, duration accuracy : ±½ cycle at beginning of event and ±½ cycle at end of event, hysteresis selectable |
| Rapid Voltage Changes (RVC) | Fully compliant and certified to IEC 61000-4-30 Ed. 3 Class A - Accuracy 0.2% |
| Unbalance | Fully compliant and certified to IEC 61000-4-30 Ed. 3 Class A Range 0.0% ~ 999.9%, method of symmetrical components, accuracy ±0.15% |
| Mains Signalling voltage | Fully compliant and certified to IEC 61000-4-30 Ed. 3 Class A Range 0% ~ 15% of nominal voltage |
| Underdeviation and Overdeviation | Fully compliant and certified to IEC 61000-4-30 Ed. 3 Class A Range 10% ~ 150% of nominal voltage, Accuracy ±0.1% of nominal voltage |
| Measurement Method | Fully compliant and certified to IEC 61000-4-30 Ed. 3, Annex C |
| Range | 0-60Vpk |
| Sampling Rate | 4Mhz on single channel, 1 MHz sampling per phase |
| Range | ±6kVpk. User-selectable threshold through 2-pole 1.5kHz high-pass filter. |
| Measurement | Fully compatible with ANSI/IEEE C62.41, C3 and B3 combination wave, ring wave and IEC 61000-4-5 waveforms |
| Connection | USB. Functional electrical isolation from PQube3. |
| Scan Time | 5 seconds max. |
| Temperature Accuracy | Typical: ±0.5°C. Max: ±2°C (-20 ~ +80°C). |
| Humidity Accuracy | Typical: ±4.5% RH (20 ~ 80% RH), max: ±7.5% (0 ~ 100% RH). |
| Barometric Pressure | Indicative measurements, resolution better than 0.001hPa |
| Mains Voltage Measuring Channels | 512 samples per cycle, phase-locked to input frequency on reference channel (L1-N or L1-L2) |
| Current Input Channels | Same rate as mains voltage measuring channels |
| Analog Input Channels | Same rate as mains voltage measuring channels |
| Digital Input Channel | Same rate as mains voltage measuring channels |
| 2-150kHz Conducted Emissions | 1 million samples per second |
| High Frequency Impulse | 4 million samples per second on single channel, or 1 million samples per second on four channels |
| Temperature | Scan time 5 seconds max |
| Humdity | Scan time 5 seconds max |
| Barometric Pressure | Scan time 5 seconds max |
| PQube 3 power supply screw terminals - AC or DC (standard) | PQube3 P+ and P- pluggable screw terminals |
| Powered from AC | 24VAC ± 10% 50/60/400Hz, 1.5A |
| Powered from DC | ±24-48VDC ±10% (polarity independent), 1A |
| Power Consumption | 20W max |
| Isolation | Internally electrically isolated from all other circuits to avoid ground loops Refer to PQube 3 Isolation Diagram |
| Input Voltage Range | 37 ~ 57VDC |
| Power Consumption | 15W max |
| Rated AC Input Range | 100 ~ 240VAC ± 10%. 50/60 Hz |
| AC Input Current Rating | 400mA |
| Supported DC Input Range | 120 ~ 370VDC |
| Auxiliary DC Power Output | 24VDC isolated, up to 5.15W max |
| Power Consumption | 20W max |
| Isolation | 3kVAC 1min, 4.2kV DC 1 min |
| Surge immunity | EN 61000-4-5 Criteria A |
| Installation Category | CAT II 300V |
| Connection | Three USB master ports: one hi-speed USB2.0 port, two standard USB1.0 ports |
| Isolation | PQube3 provides functional isolation to Earth (eliminates ground loops). |
| Type | microSD |
| Capacity | 8GB standard (stores up to 3 years of data under normal use) |
| Connection | Standard RJ-45 socket (wired Ethernet). Transformer isolated. IP address can be assigned via DHCP or manually set fixed IP. |
| Sends emails after every event with data attached; user request real-time meters via e-mail, PQube3 firmware upgrade via email, change PQube3 setup via email, incoming e-mail filters. Includes GIF graphs, CSV spreadsheet files, PQDIF, HTML and XML summaries Protocols: POP3, SMTP, and SSL over SMTP | |
| Web Server | More than 30 real-time meters. All events, trends and statistics recordings. Includes GIF graphs, CSV spreadsheet files, PQDIF, HTML and XML summaries. |
| Modbus over TCP | More than 50 real-time meters with update rate of approximately 0.5 seconds - see PQube3 Modbus Specification document. Event/trend-statistics counters can be used for triggering downloads via FTP or web server. |
| FTP Server | File Transfer Protocol. Transfers files from PQube3 SD card to and from any computer. |
| SNTP | Simple Network Time Protocol for synchronizing PQube3 real-time clock to UTC. |
| Internal Real-Time Clock | Fully compliant with IEC 61000-4-30 Ed. 3 Class A Drift: Typical ±30 seconds/yr. Temperature compensated. ±70 seconds/yr. max drift |
| SNTP | Accuracy: ±10 to 100 milliseconds absolute, UTC time. Dependent on network latency. |
| Micro Synchrophasor | Accuracy better than 0.01° |
| Operating Temperature | Minimum -20°C, Maximum 65°C with no load on 24V power supply terminals, Maximum 55°C with 5.15W load on 24V power supply terminals |
| Operating Humidity | 5% RH ~ 95% RH non-condensing, indoor use |
| Altitude | Maximum 2000 meters above sea level |
| Overvoltage Category | 2or PQube 3 AC mains measuring terminals, Overvoltage Category III 600V. For PM1 input terminals, Overvoltage Category II 300V. |
| Isolation | Internally electrically isolated from all other circuits to avoid ground loops Refer to PQube 3 Isolation Diagram |
| Pollution Degree | 2 |
| Isolation | UL/IEC 61010:2010 - 3.6kV AC 1min , 5.1kVDC 1 min, 5.4kVAC (5sec), 9.6kVpk impulse. |
| Surge | UL/IEC 61010:2010 - 3.6kV AC 1min , 5.1kVDC 1 min, 5.4kVAC (5sec), 9.6kVpk impulse. |
| Installation Category | CAT IV UL/IEC 61010 for voltages up to 300 VAC L-N (equivalent to 480 VAC L-L), CAT III for voltages up to 600VAC L-N. Pollution degree 2. |
| Transient Voltages | 100kHz ring wave, 6 kV pk, IEC 61180, IEC 61000-4-5. Applied to voltage measuring terminals with Performance Evaluation Class 1. (When applied to optional power supply mains terminal, supply's fuse may operate in PE Class 3 at test levels greater than 4 kV.) |
| EFT Burst Immunity | 4 kV pk, IEC 61000-4-4, Performance Evaluation Class 1. Applied to power measuring terminals and optional PS1 power supply mains terminals. |
| RF Field Strength Immunity | 3V / m, IEC 61000-4-3 Test Level 2. |
| IMagnetic Field Strength Immunity | 30A / m, IEC 61000-4-8 Test Level 4. |
| Ingress Protection Rating (IP Rating) | IP20H, IEC 60529. |